Events
Movies portray a particular historical event
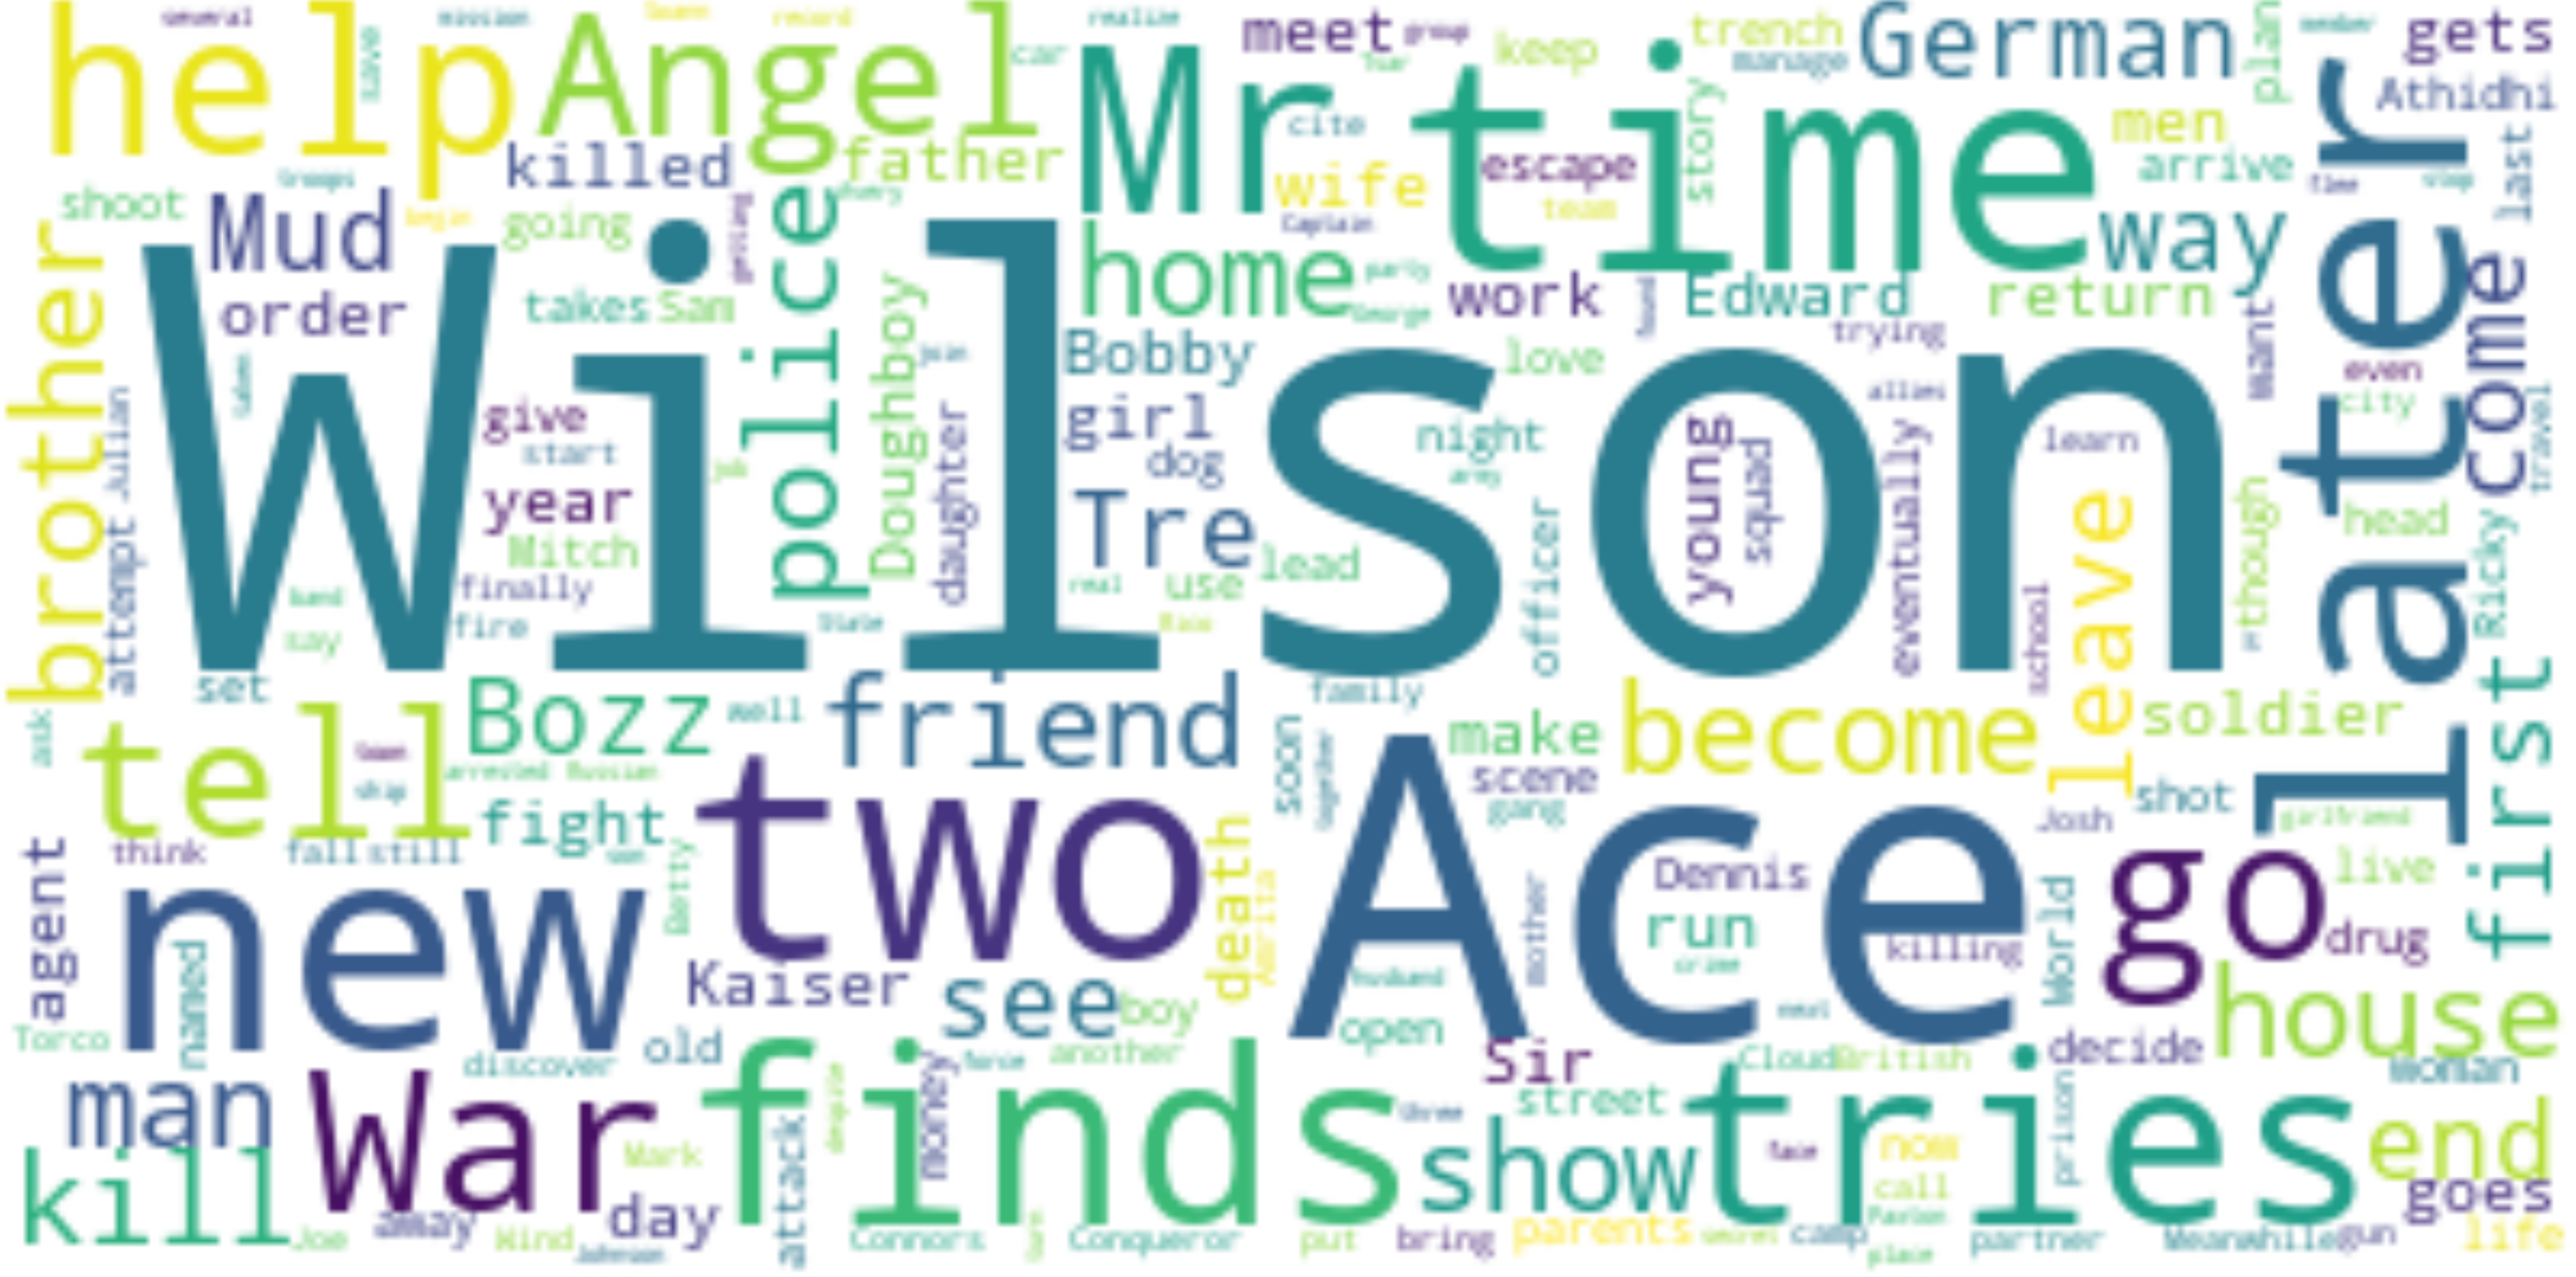
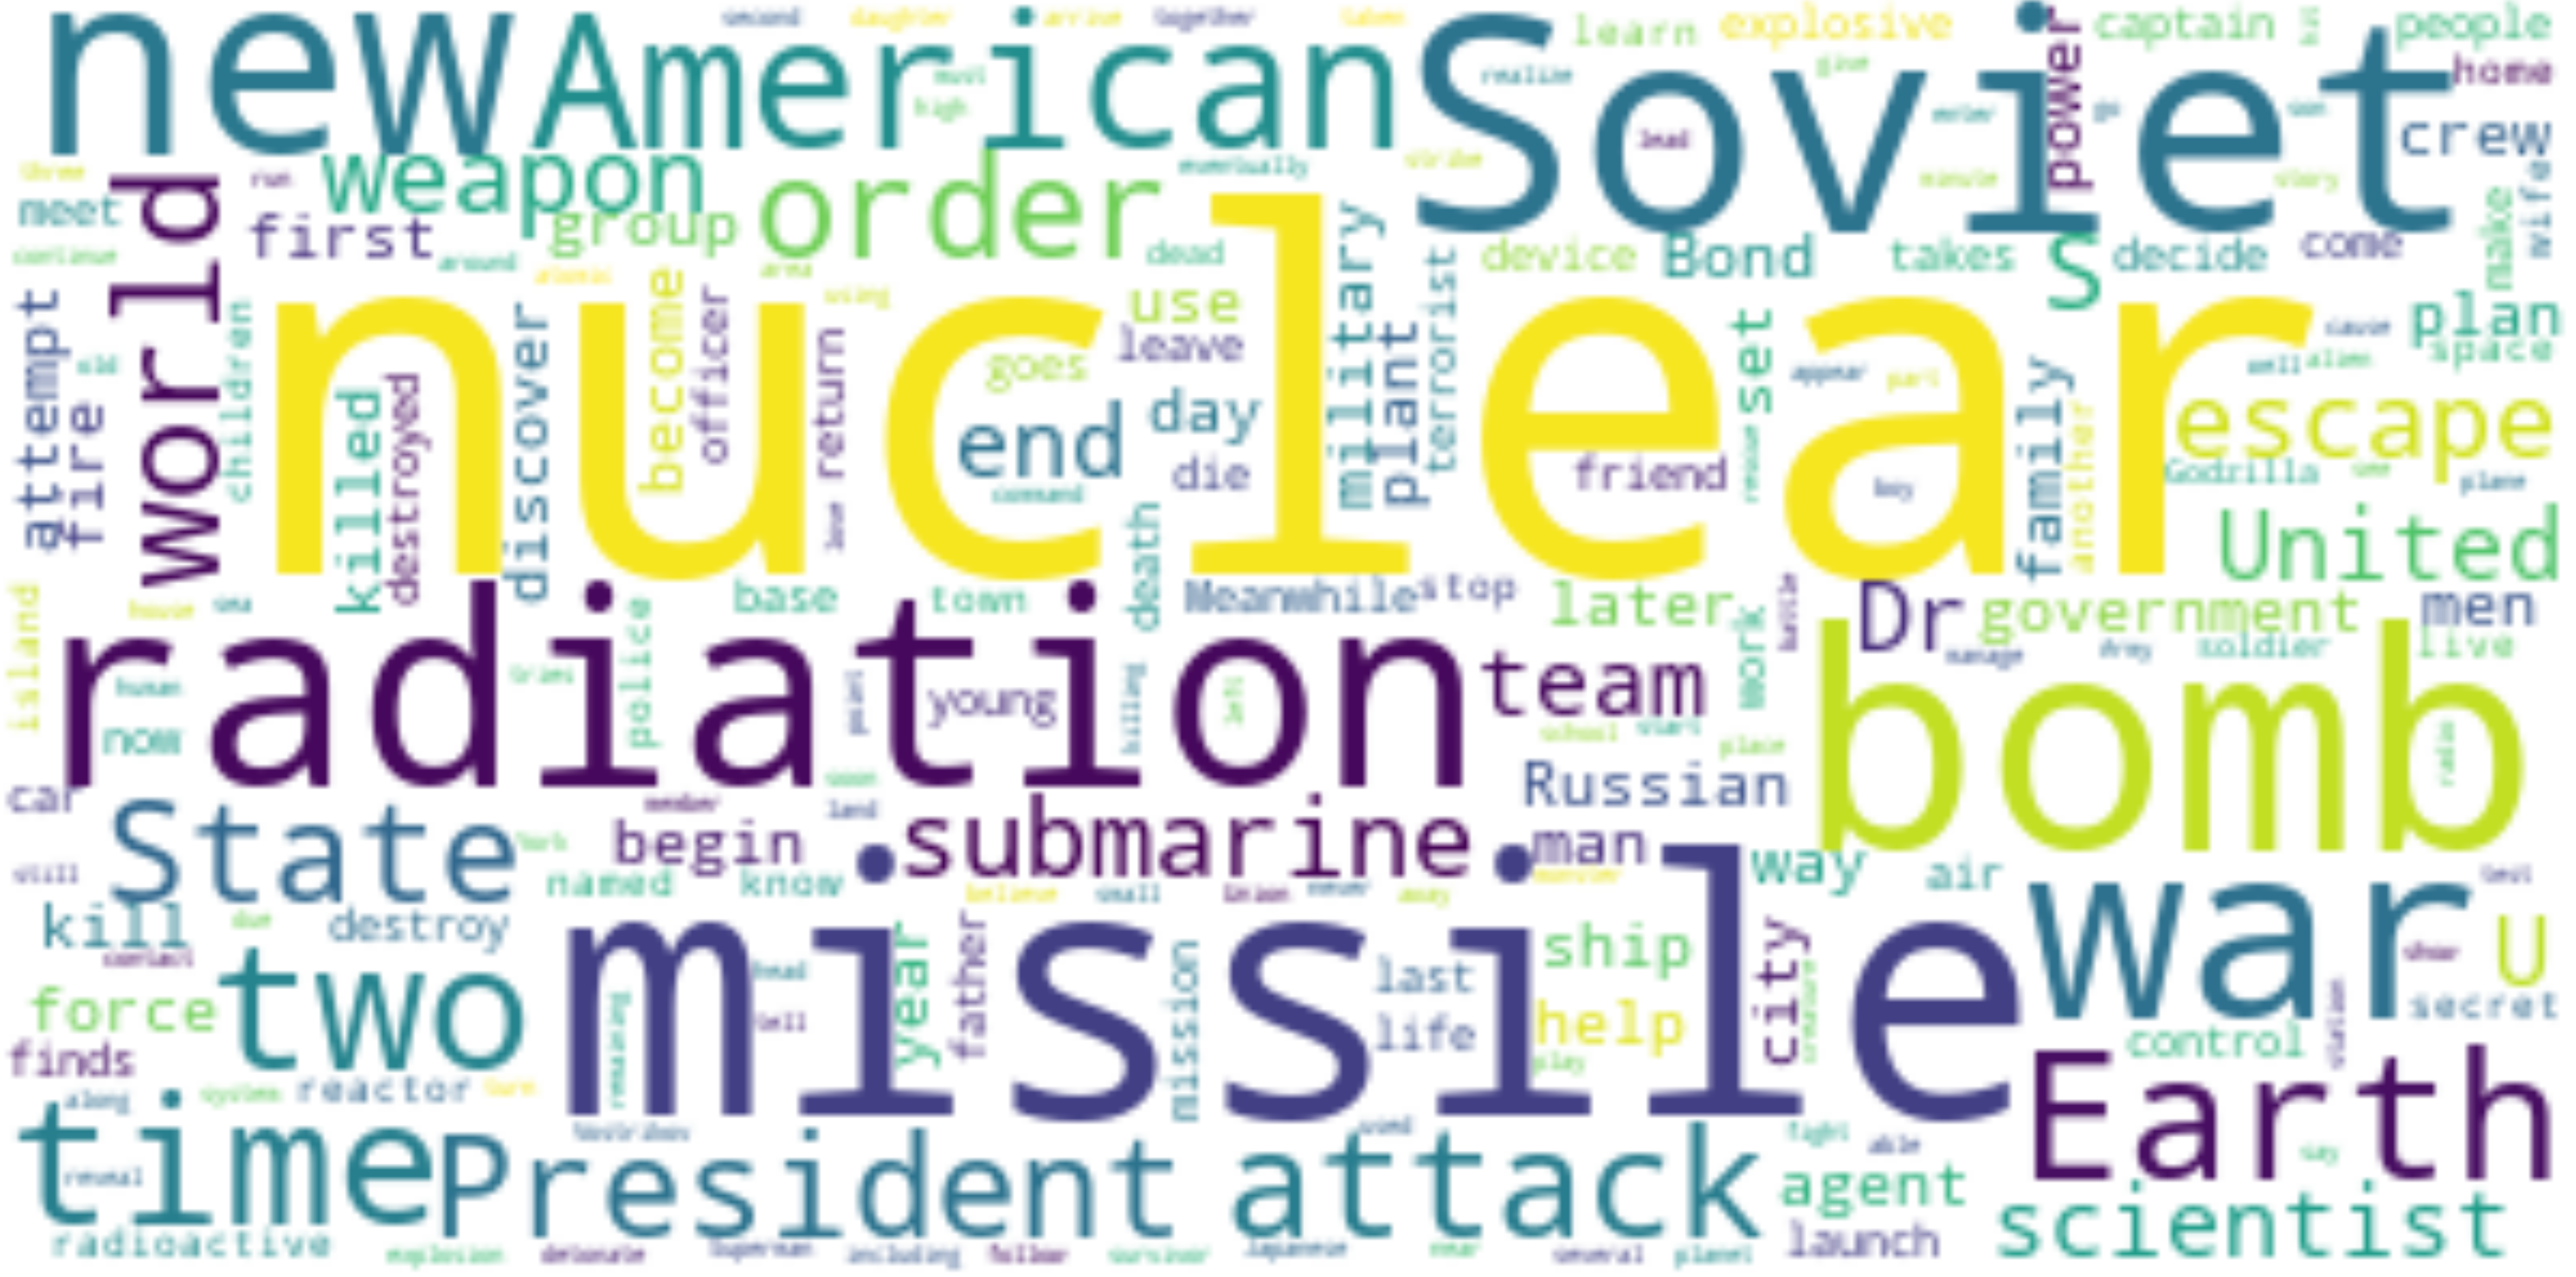
To classify movies as depicting a particular event, we created ‘dictionaries’. These are lists of words that are specific to a historical event. These events are either defined by a finite period of time (e.g. World War I) or are movements that appeared at a certain time and then evolved in a continuous manner throughout the years and eventually reached an end.
The aim here is to parse the summary plot of each movie through these dictionaries in order to identify if the movie is related to the event either in his subject or his decorum. With that goal in mind, we chose some events that seem most recognizable in the summaries, using their different lexical fields.
To associate a movie with an event we first count the number of times each word in the dictionary occurs in its plot summary. Then we decide to assign the movie to the corresponding historical event if the word count is greater than a hand-picked threshold.
This threshold is designed to take into account the size of our dictionaries in order to improve the specificity and sensitivity of our classification method. When the dictionary is big, more words can be identified in each summary, leading to more summaries classified as the corresponding historical event. To avoid this bias, we penalized bigger dictionaries by performing a rescaled min-max normalization on their length. This coefficient was then added to a common baseline threshold. By doing so, movies’ word count would need to reach a bigger threshold for events with bigger dictionaries.
We performed a sanity check by labelling a small portion of the data and analyzing the precision-recall curve and f1 scores for our dictionary search technique. This enabled us to verify the accuracy of our classifier and to determine the optimal threshold value.
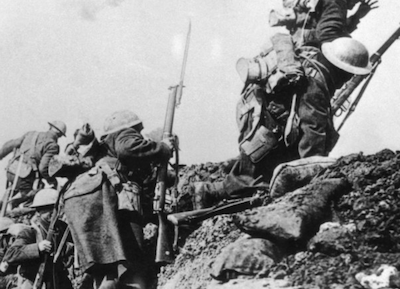
World War I
1914-1918
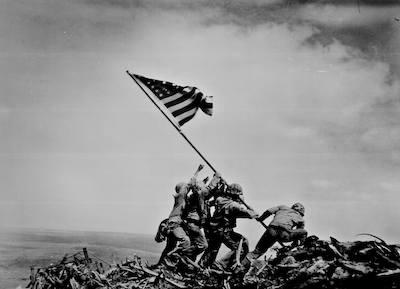
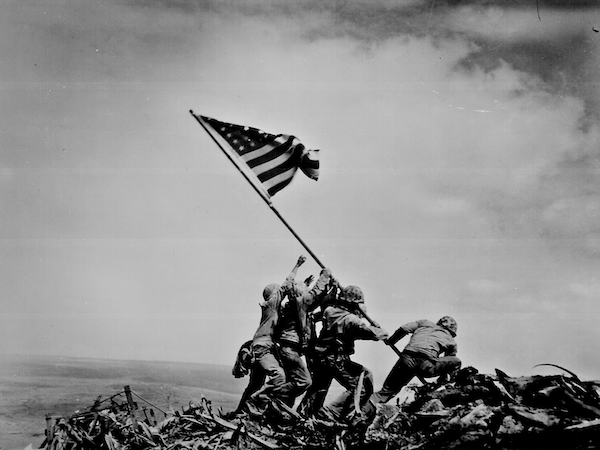
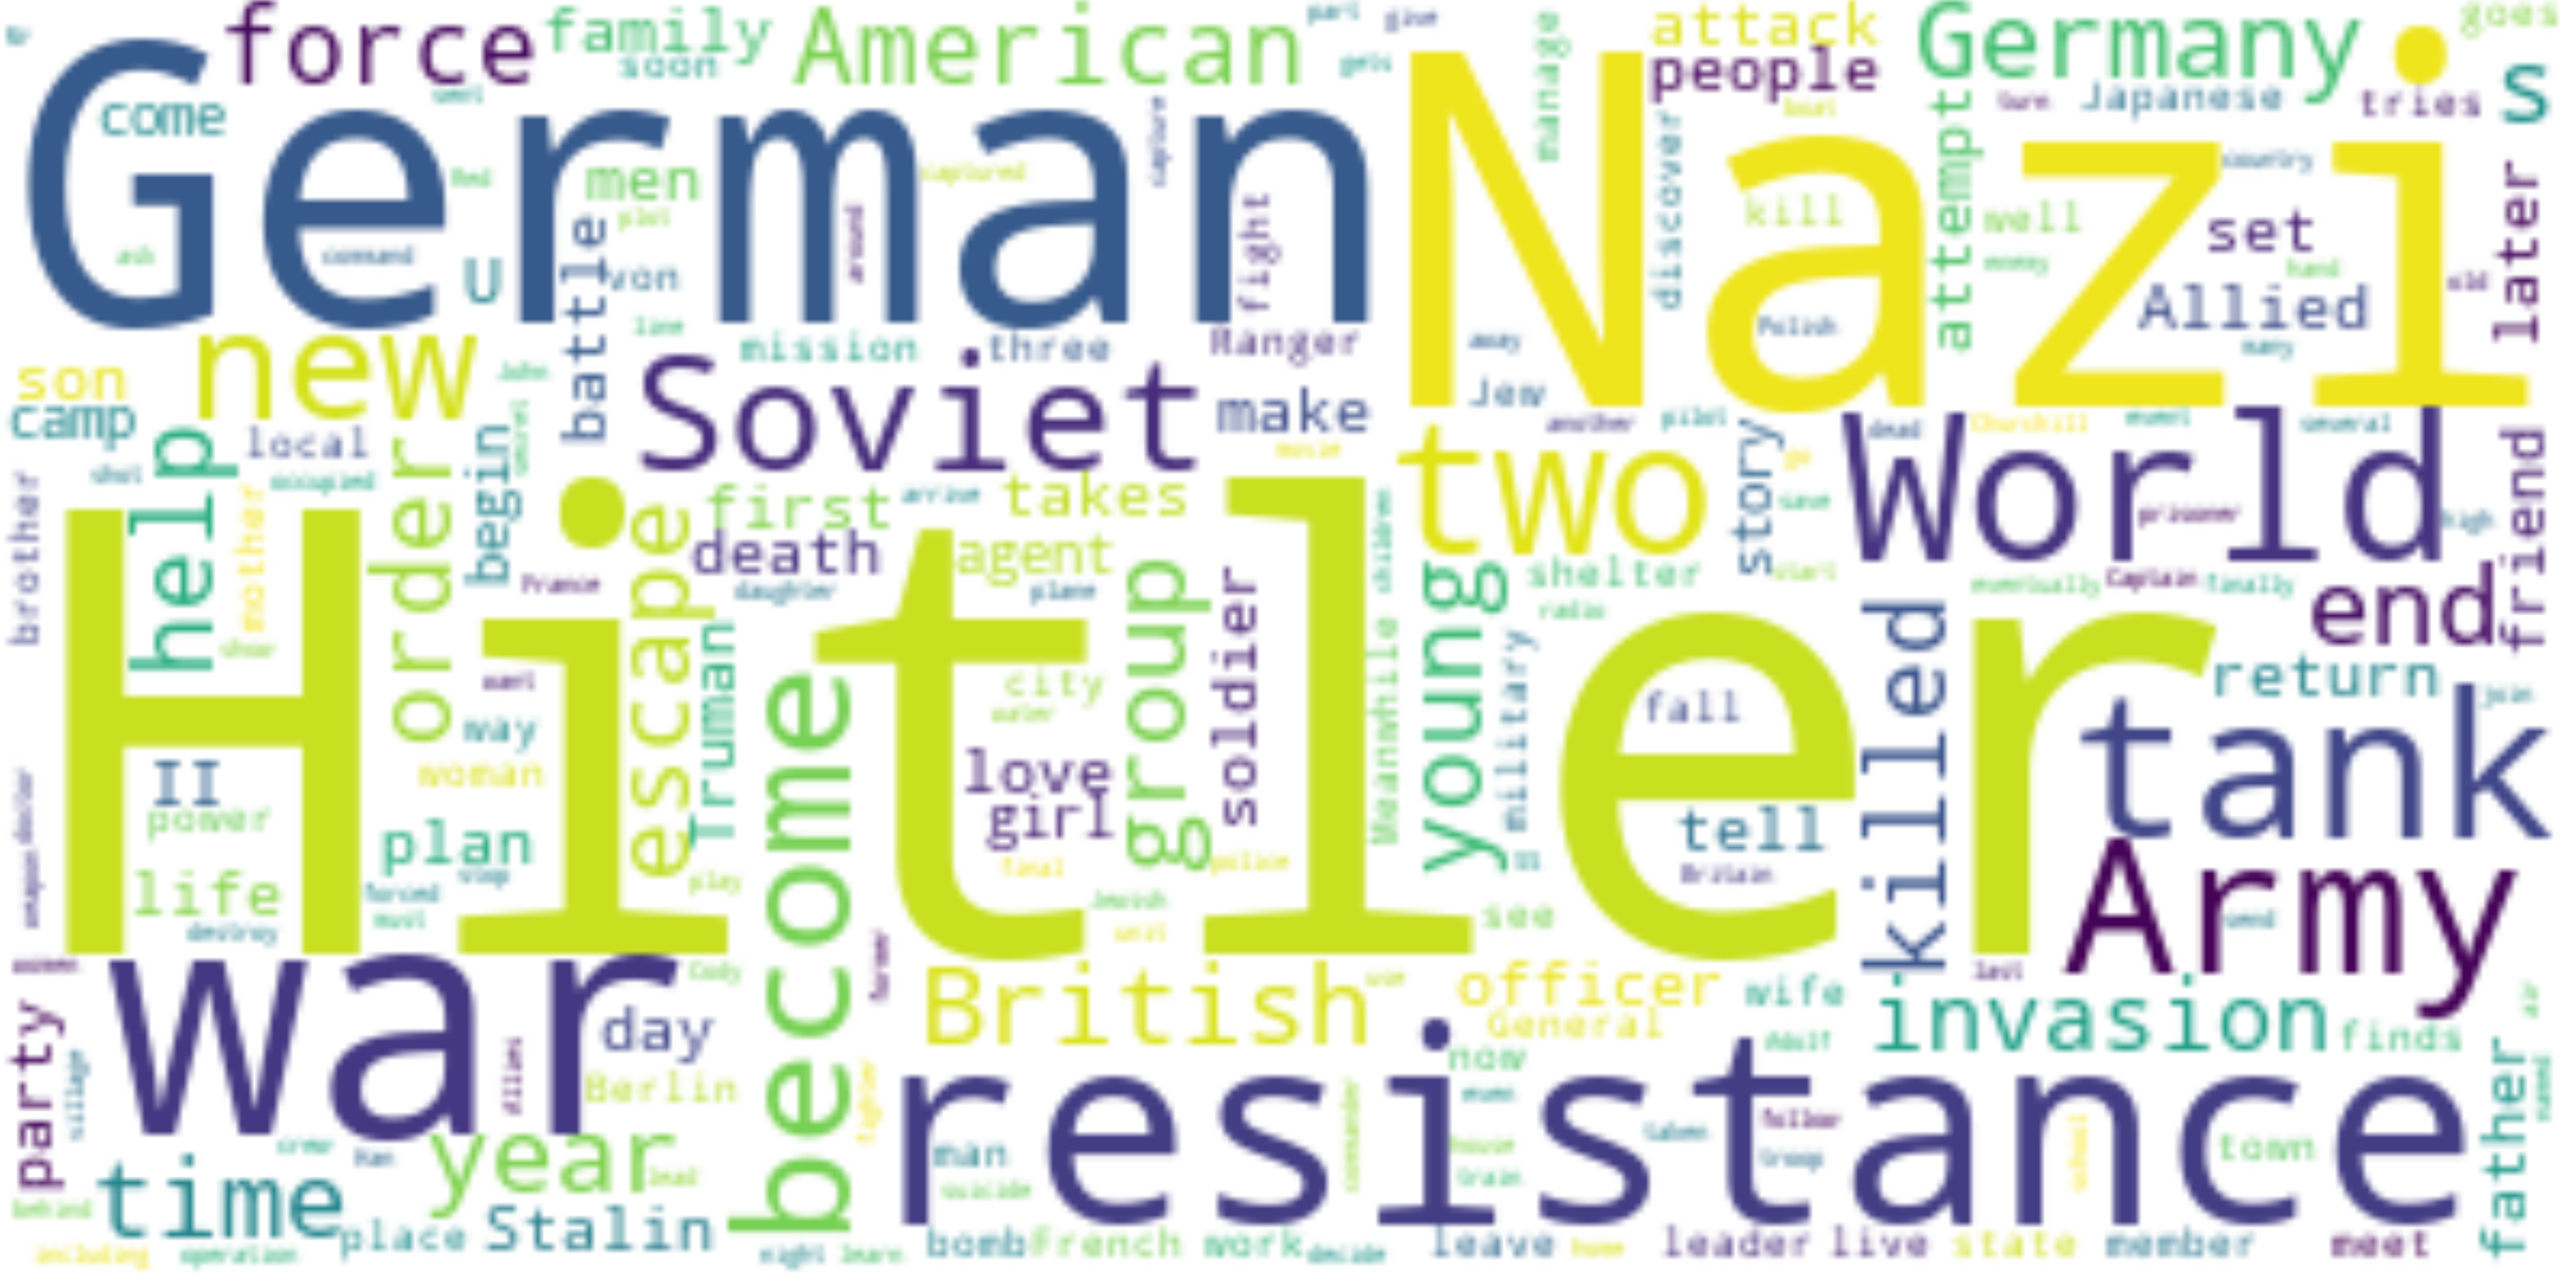
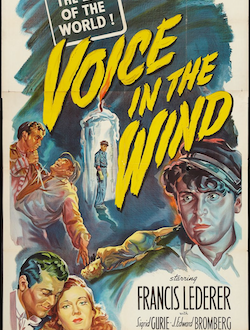
World War II
1939-1945

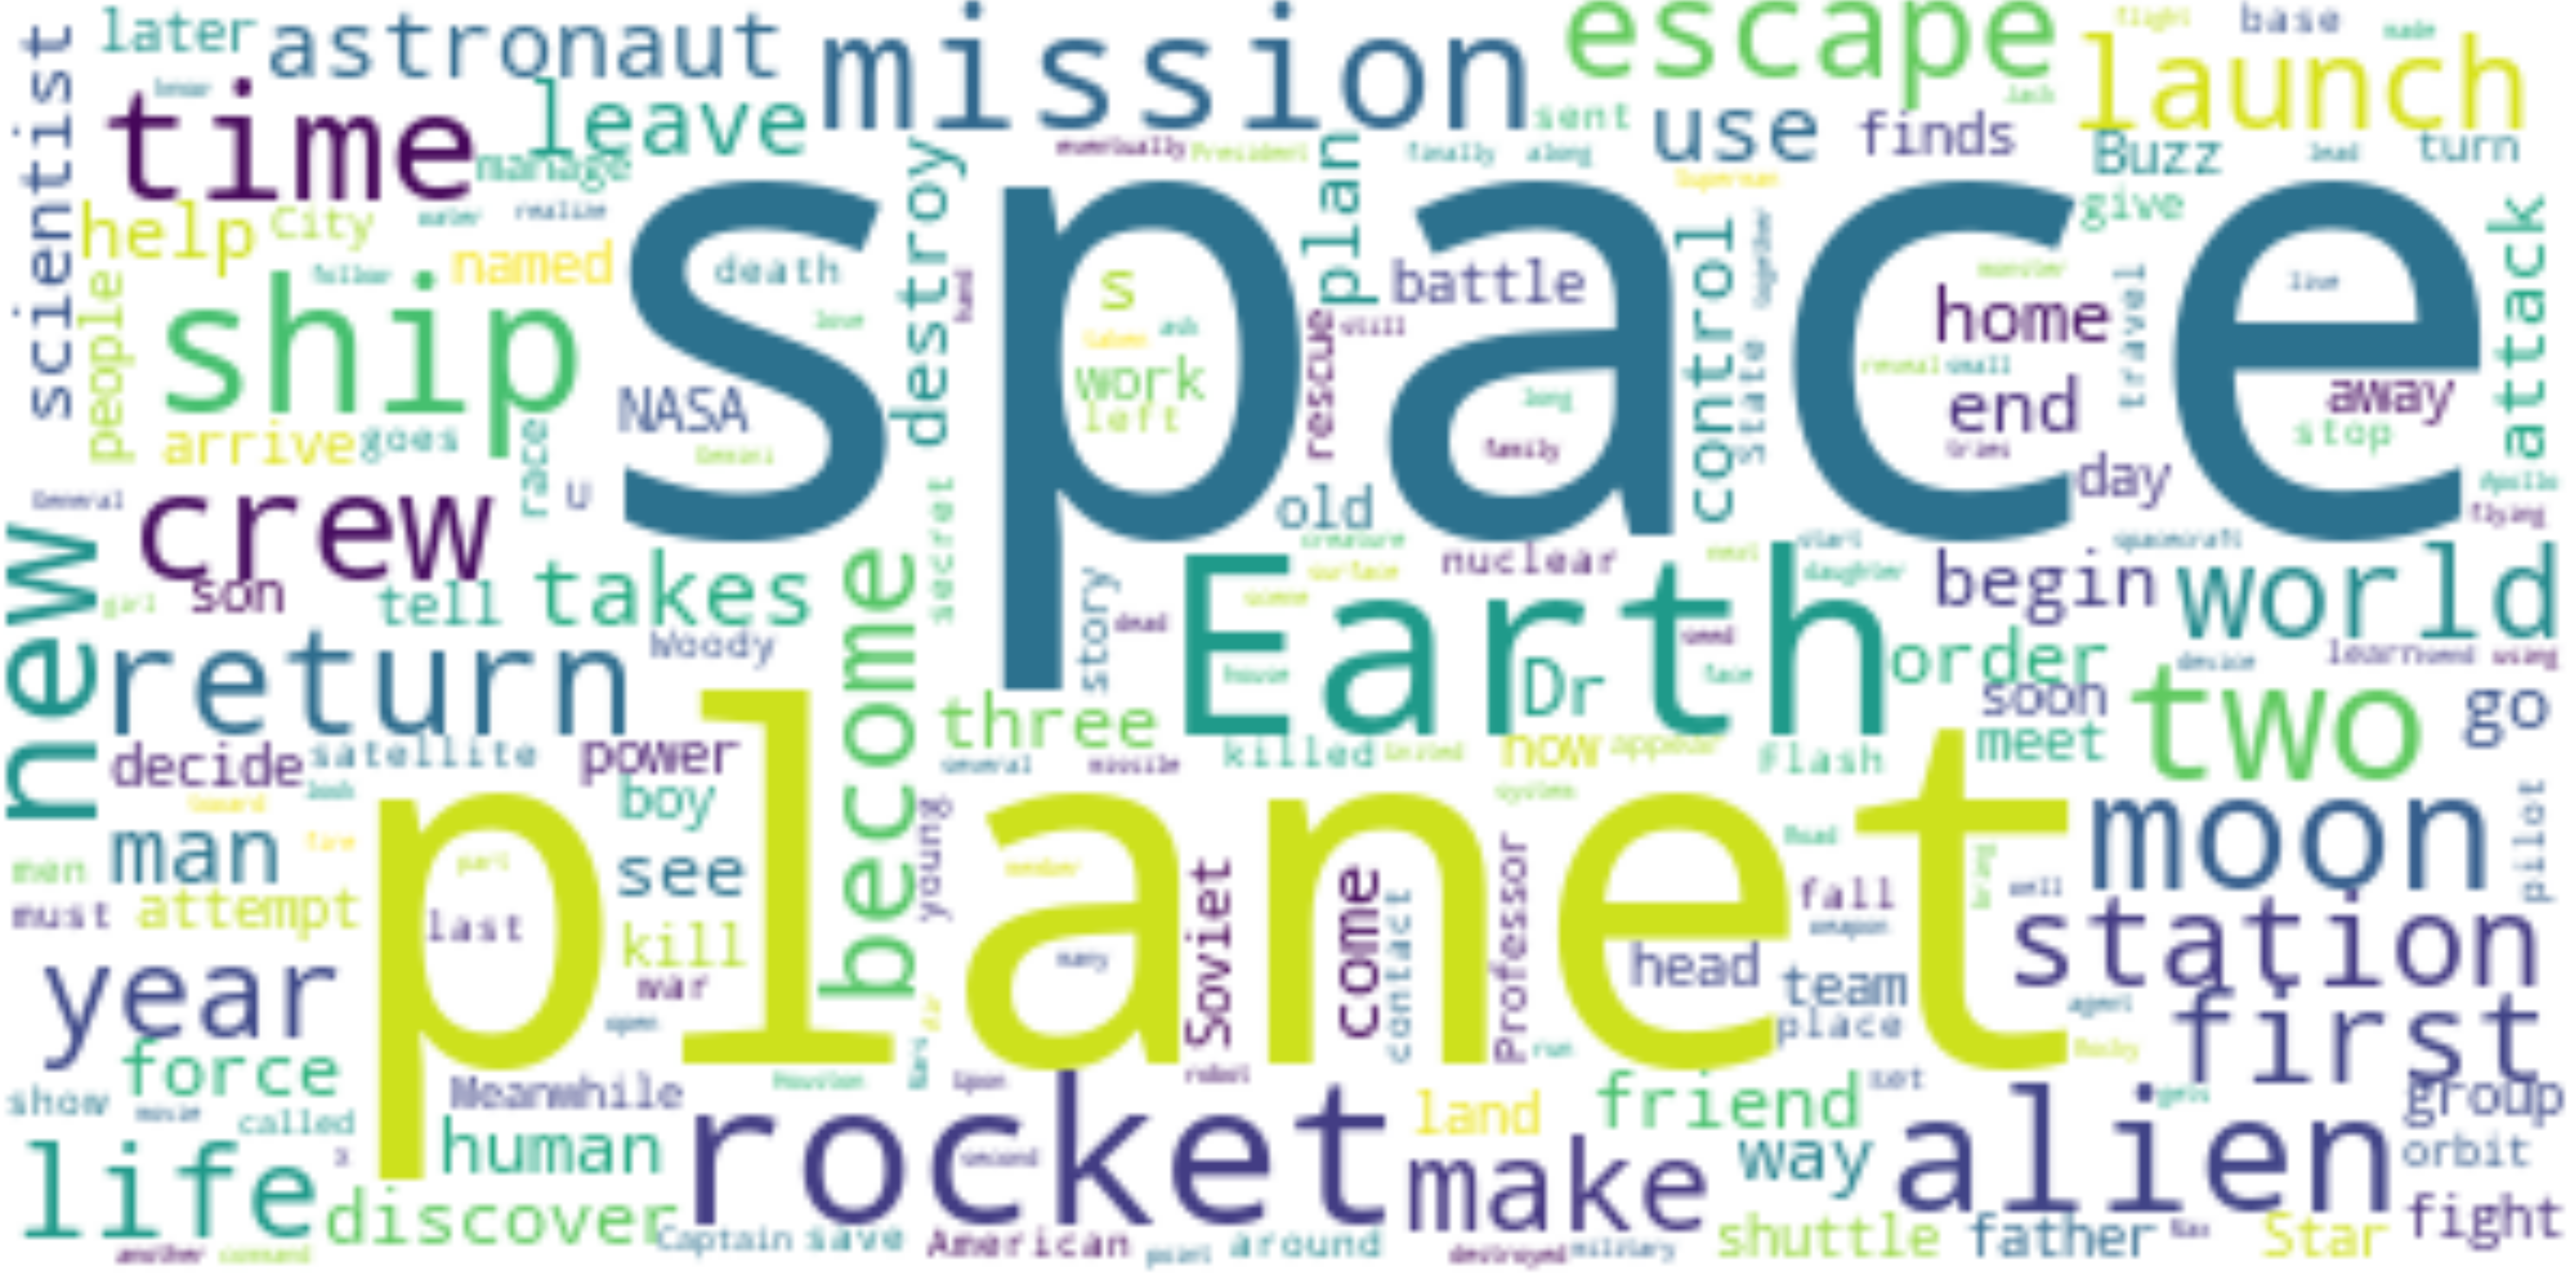
Space Race
1960-
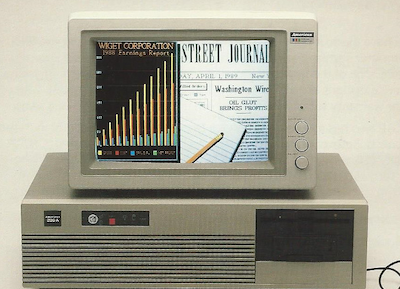
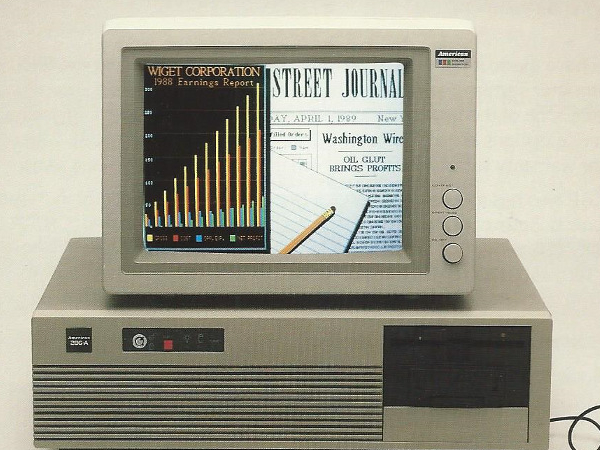
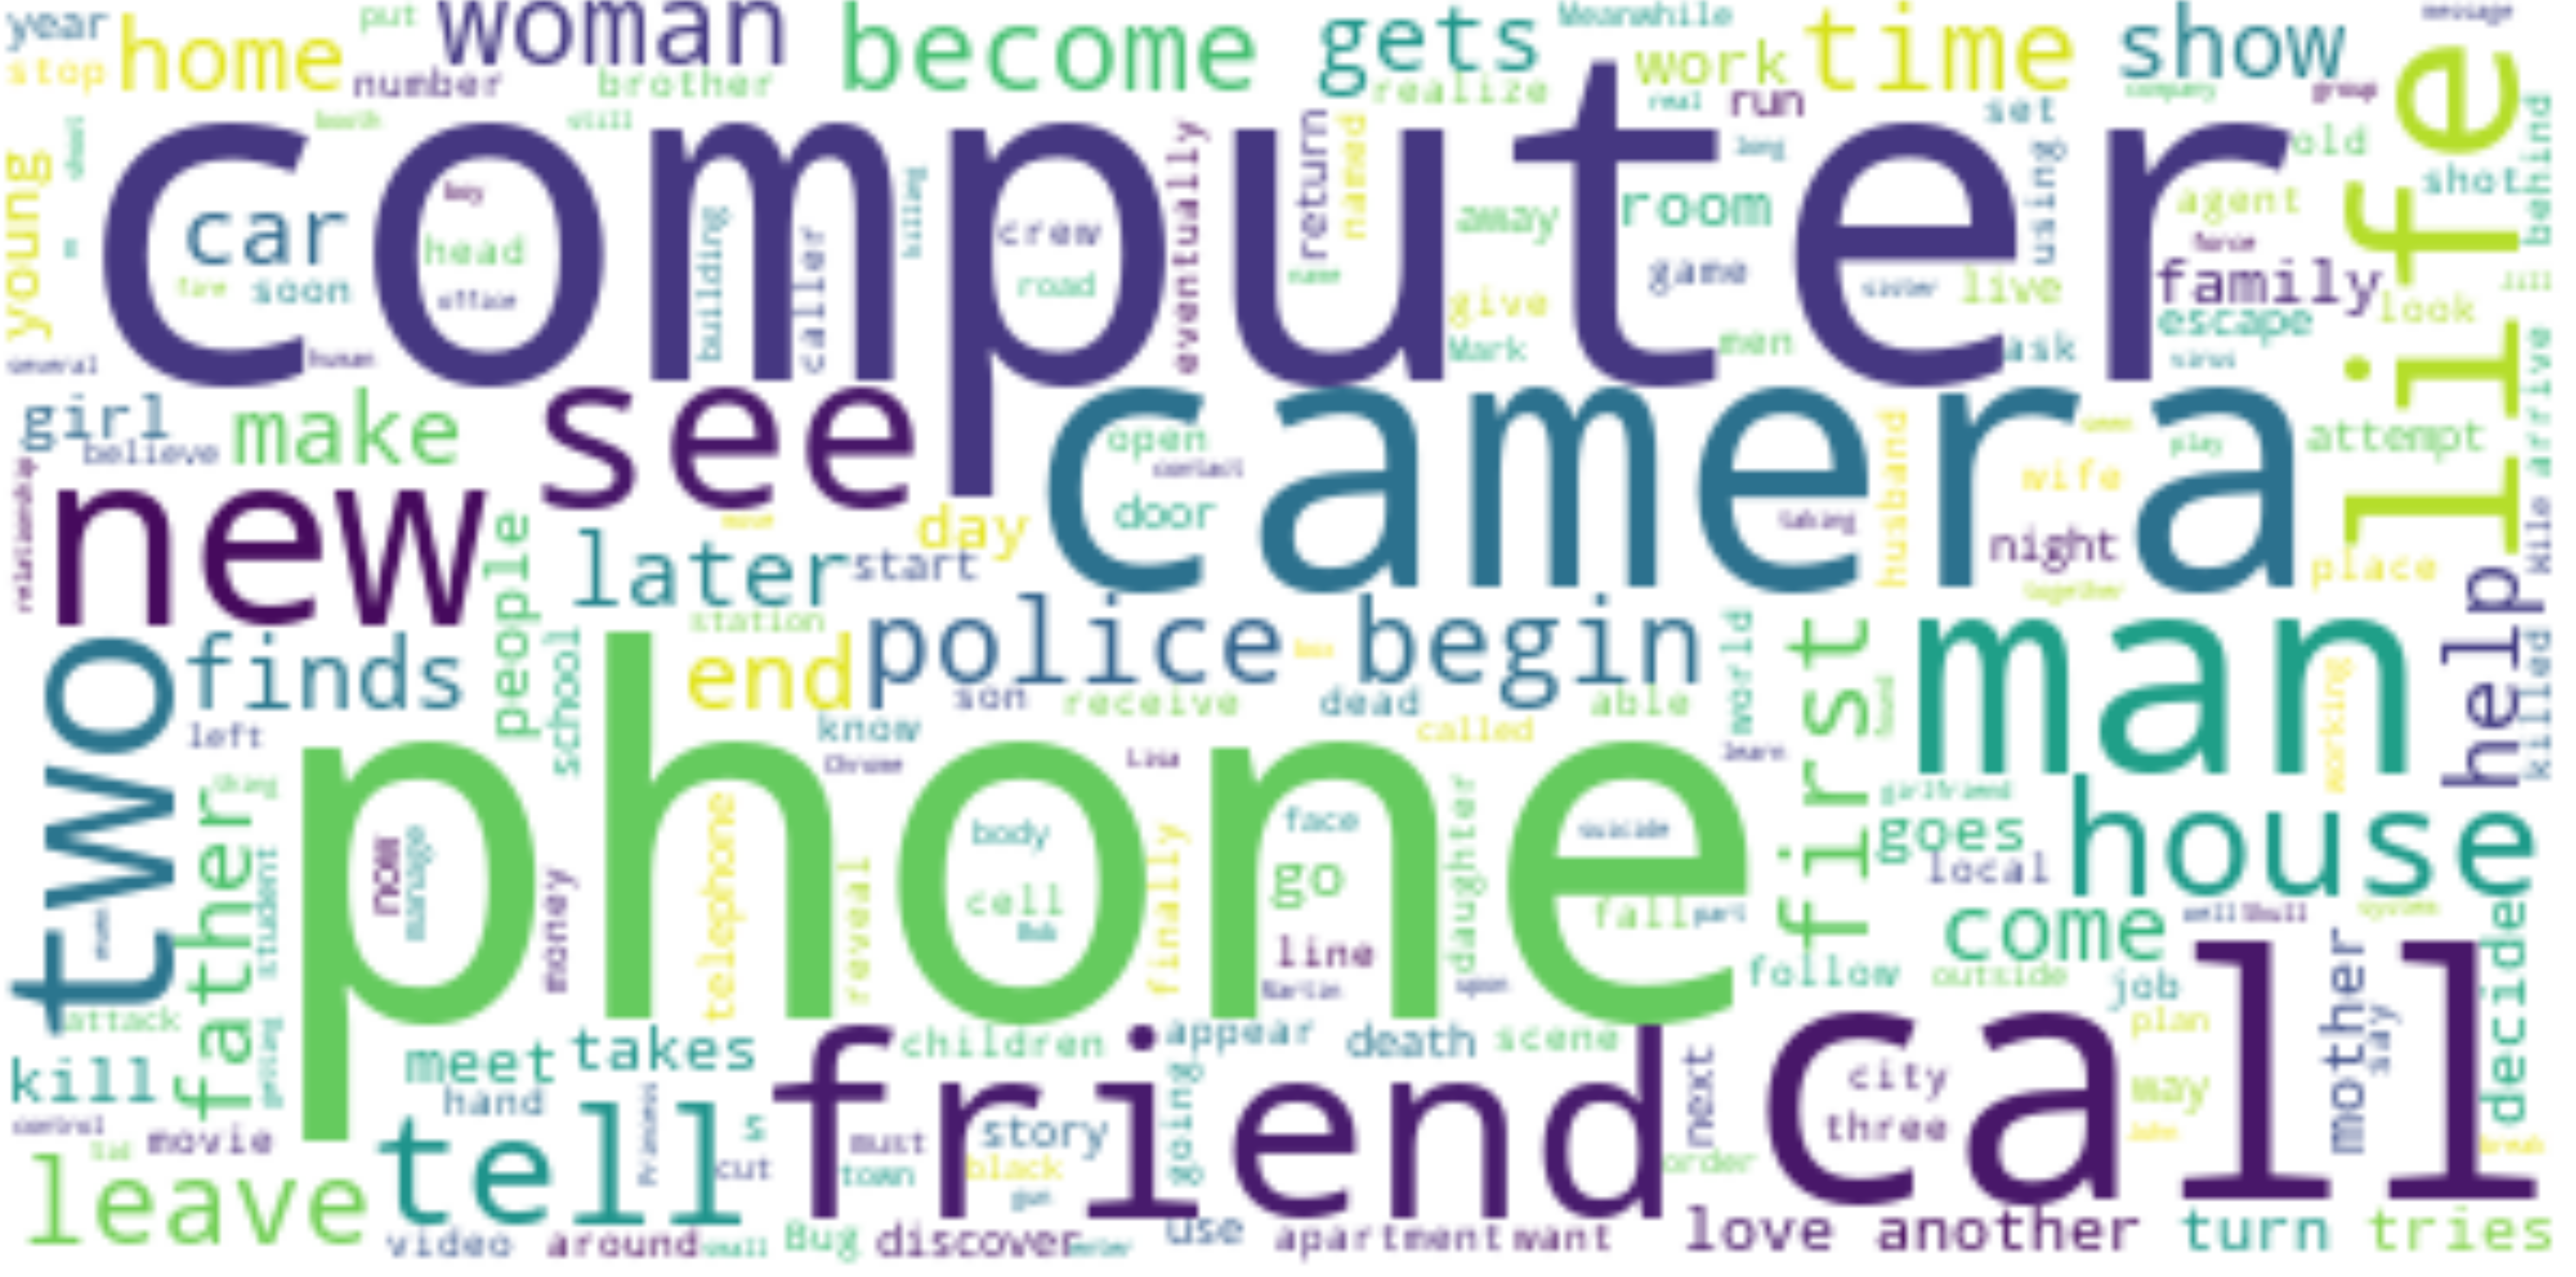
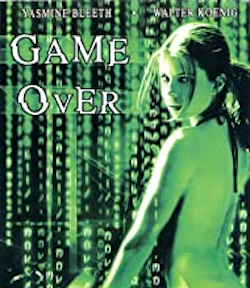
Digital Revolution
~1960-

Industry 4.0
~2000-

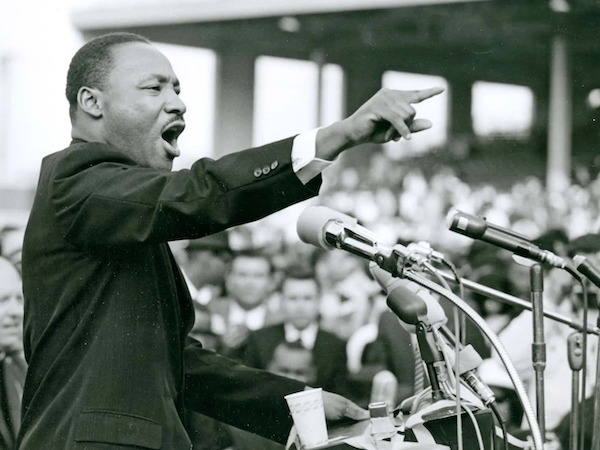
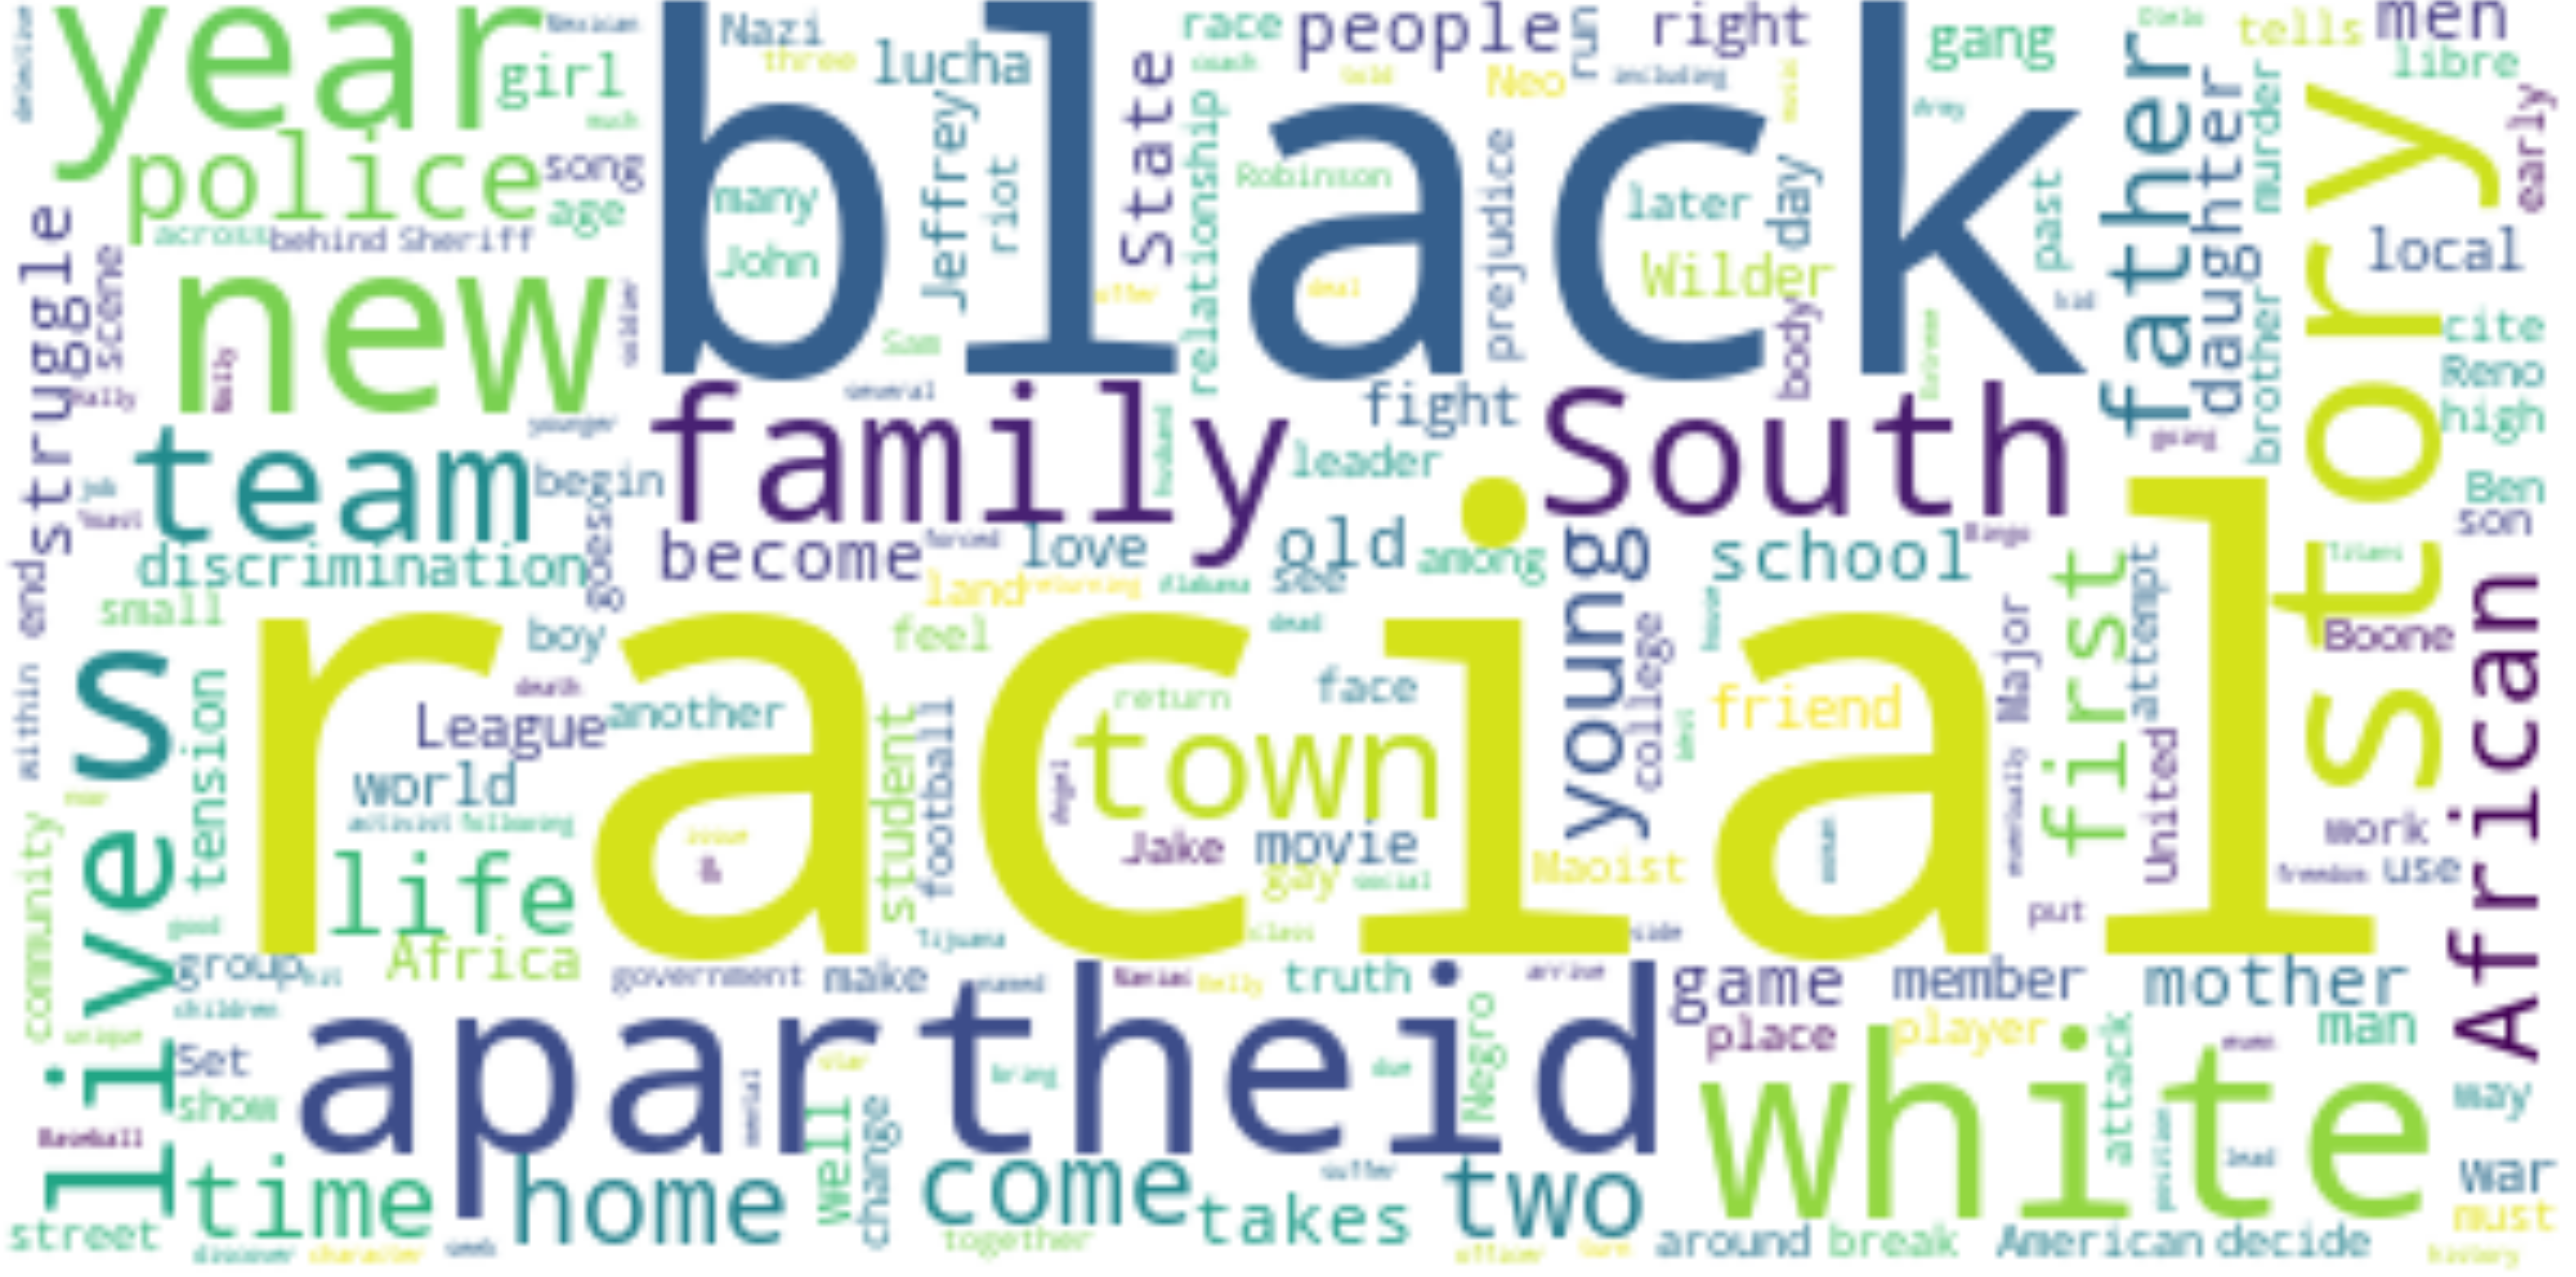
Racial Segregation
-1965

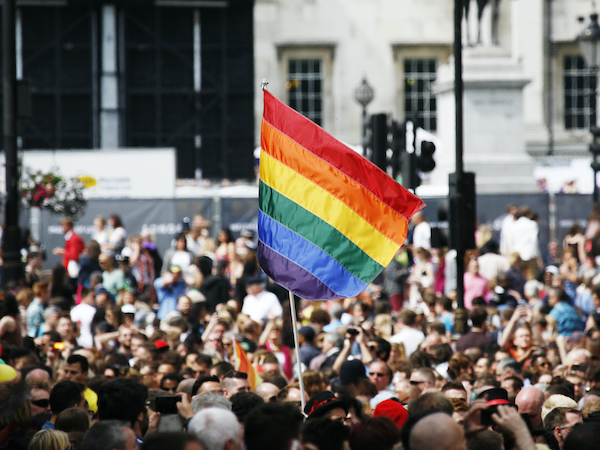
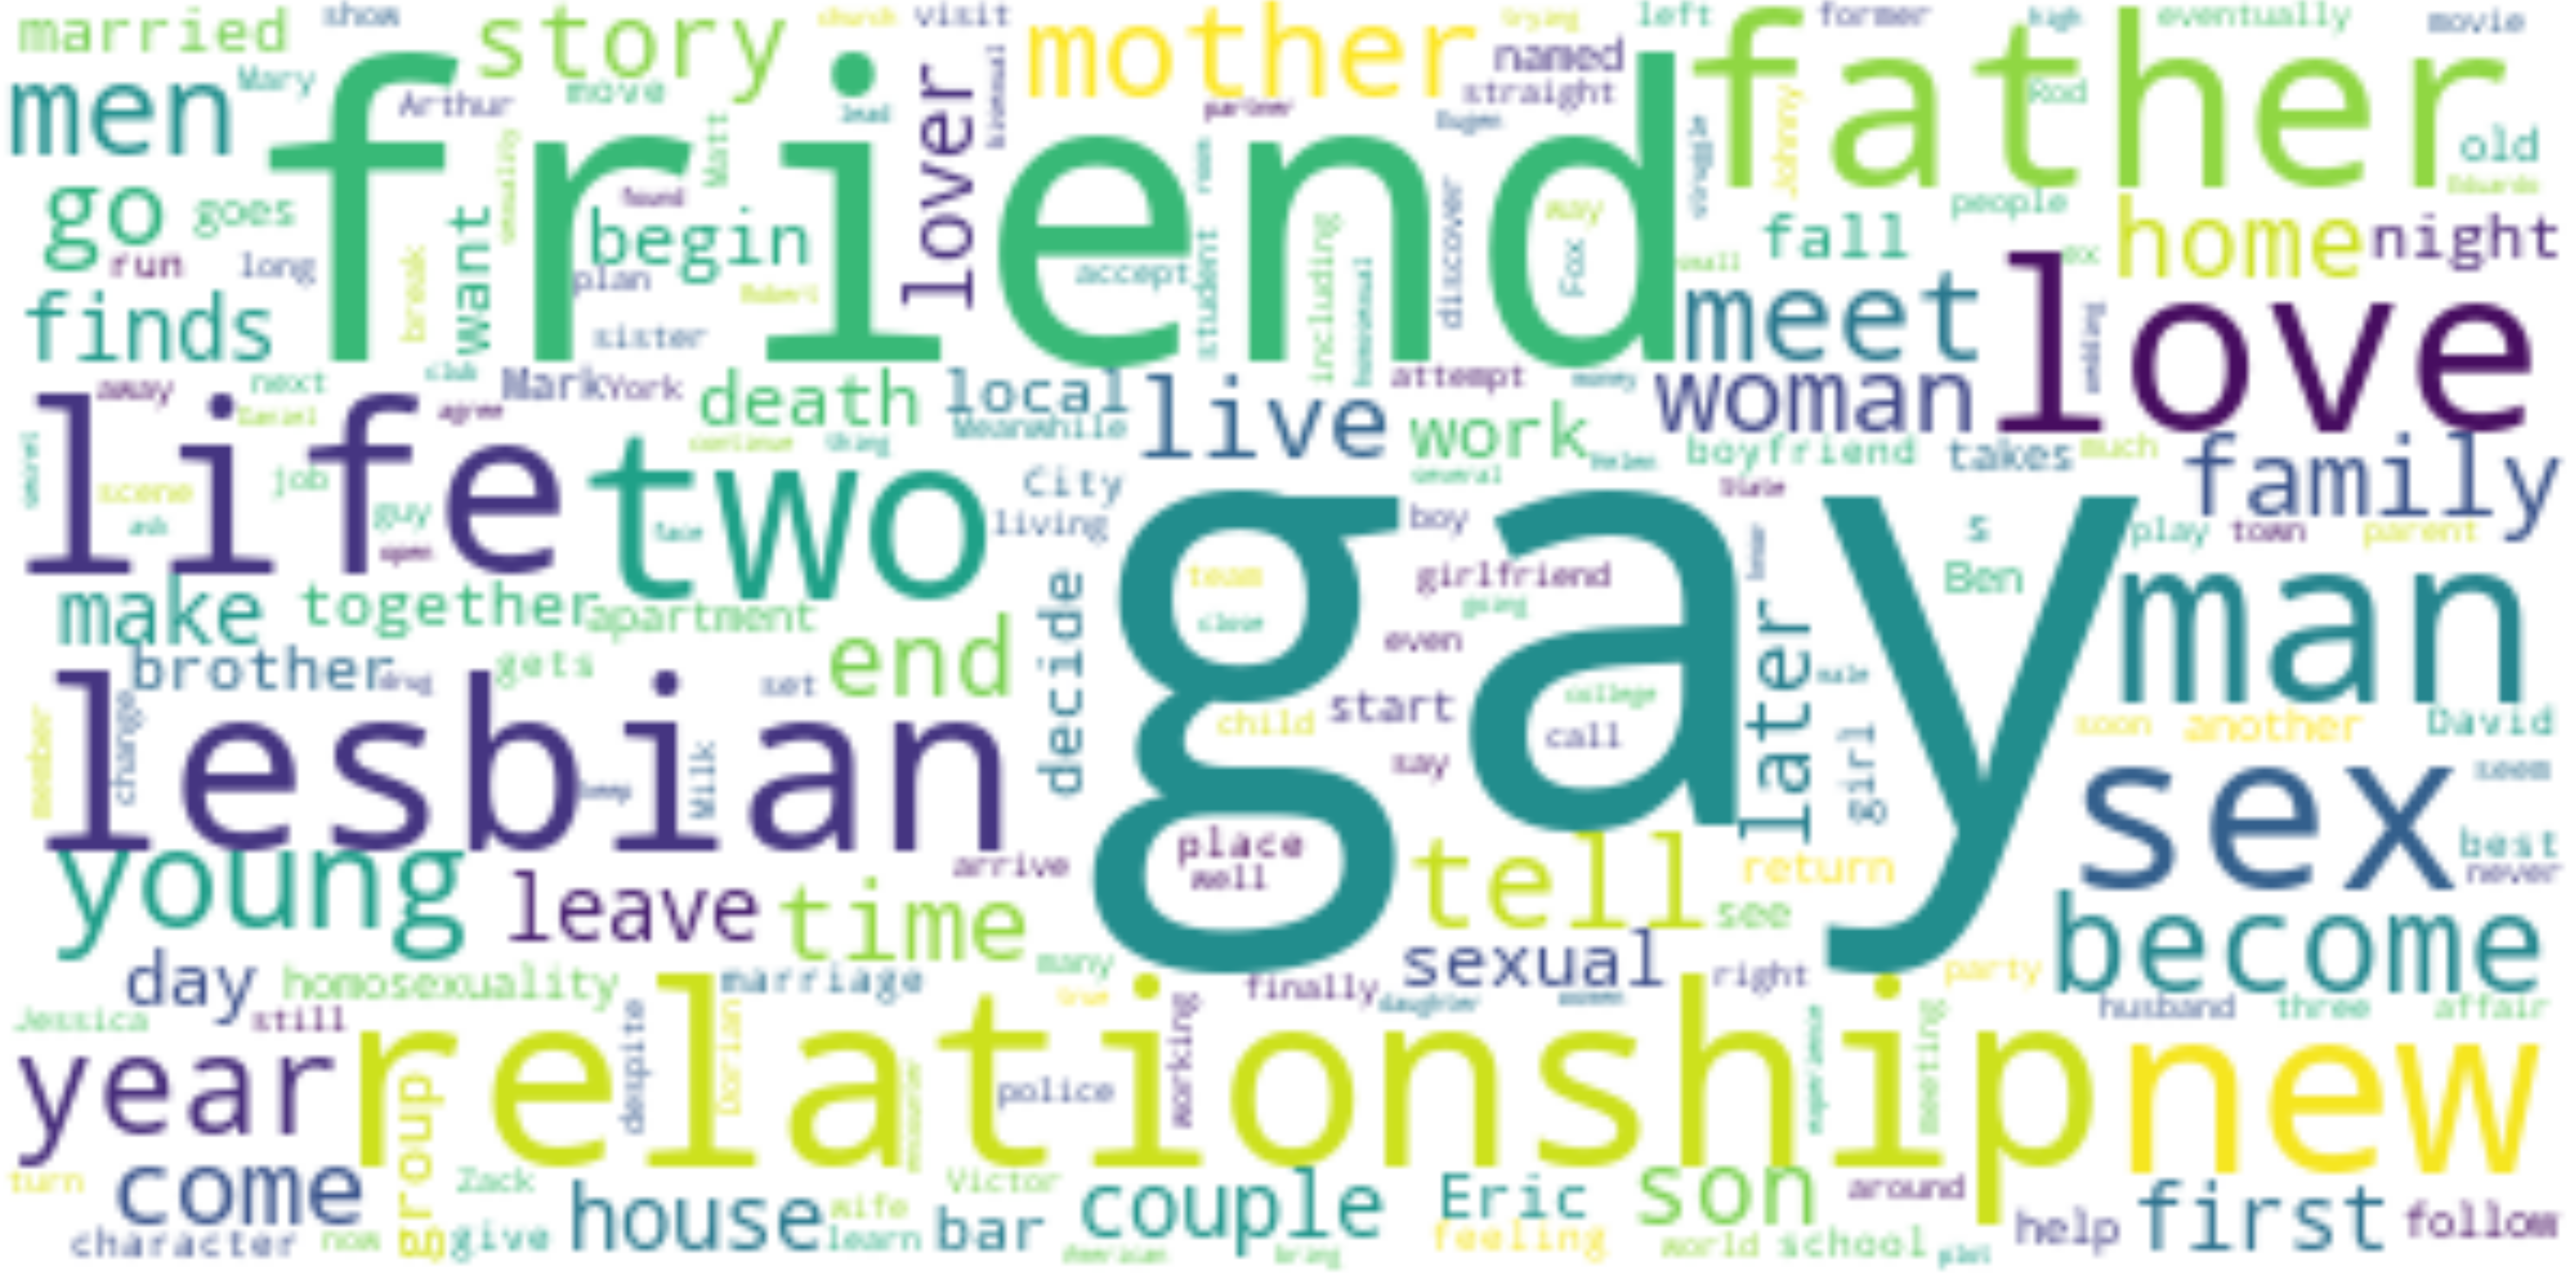
LGBTQ+
~1960-

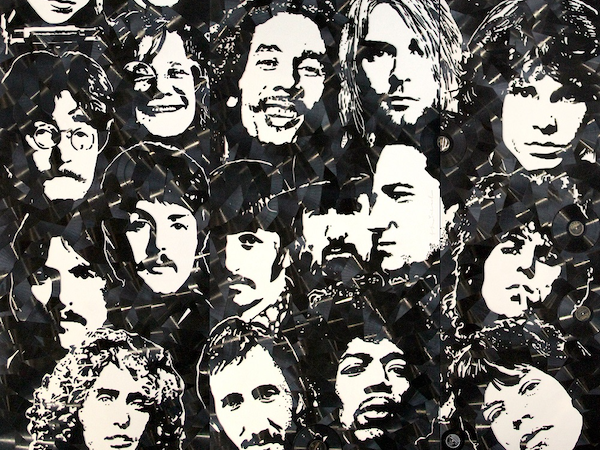
Rock Music
~1950-

AIDS & HIV
1981-
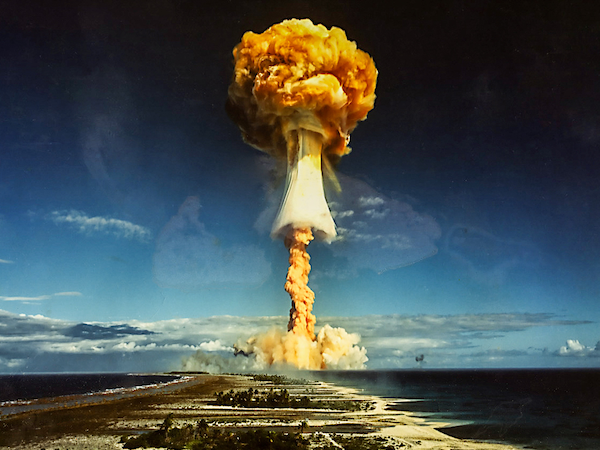
Nuclear Weapon
1945-
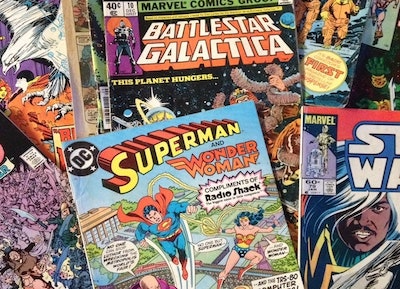
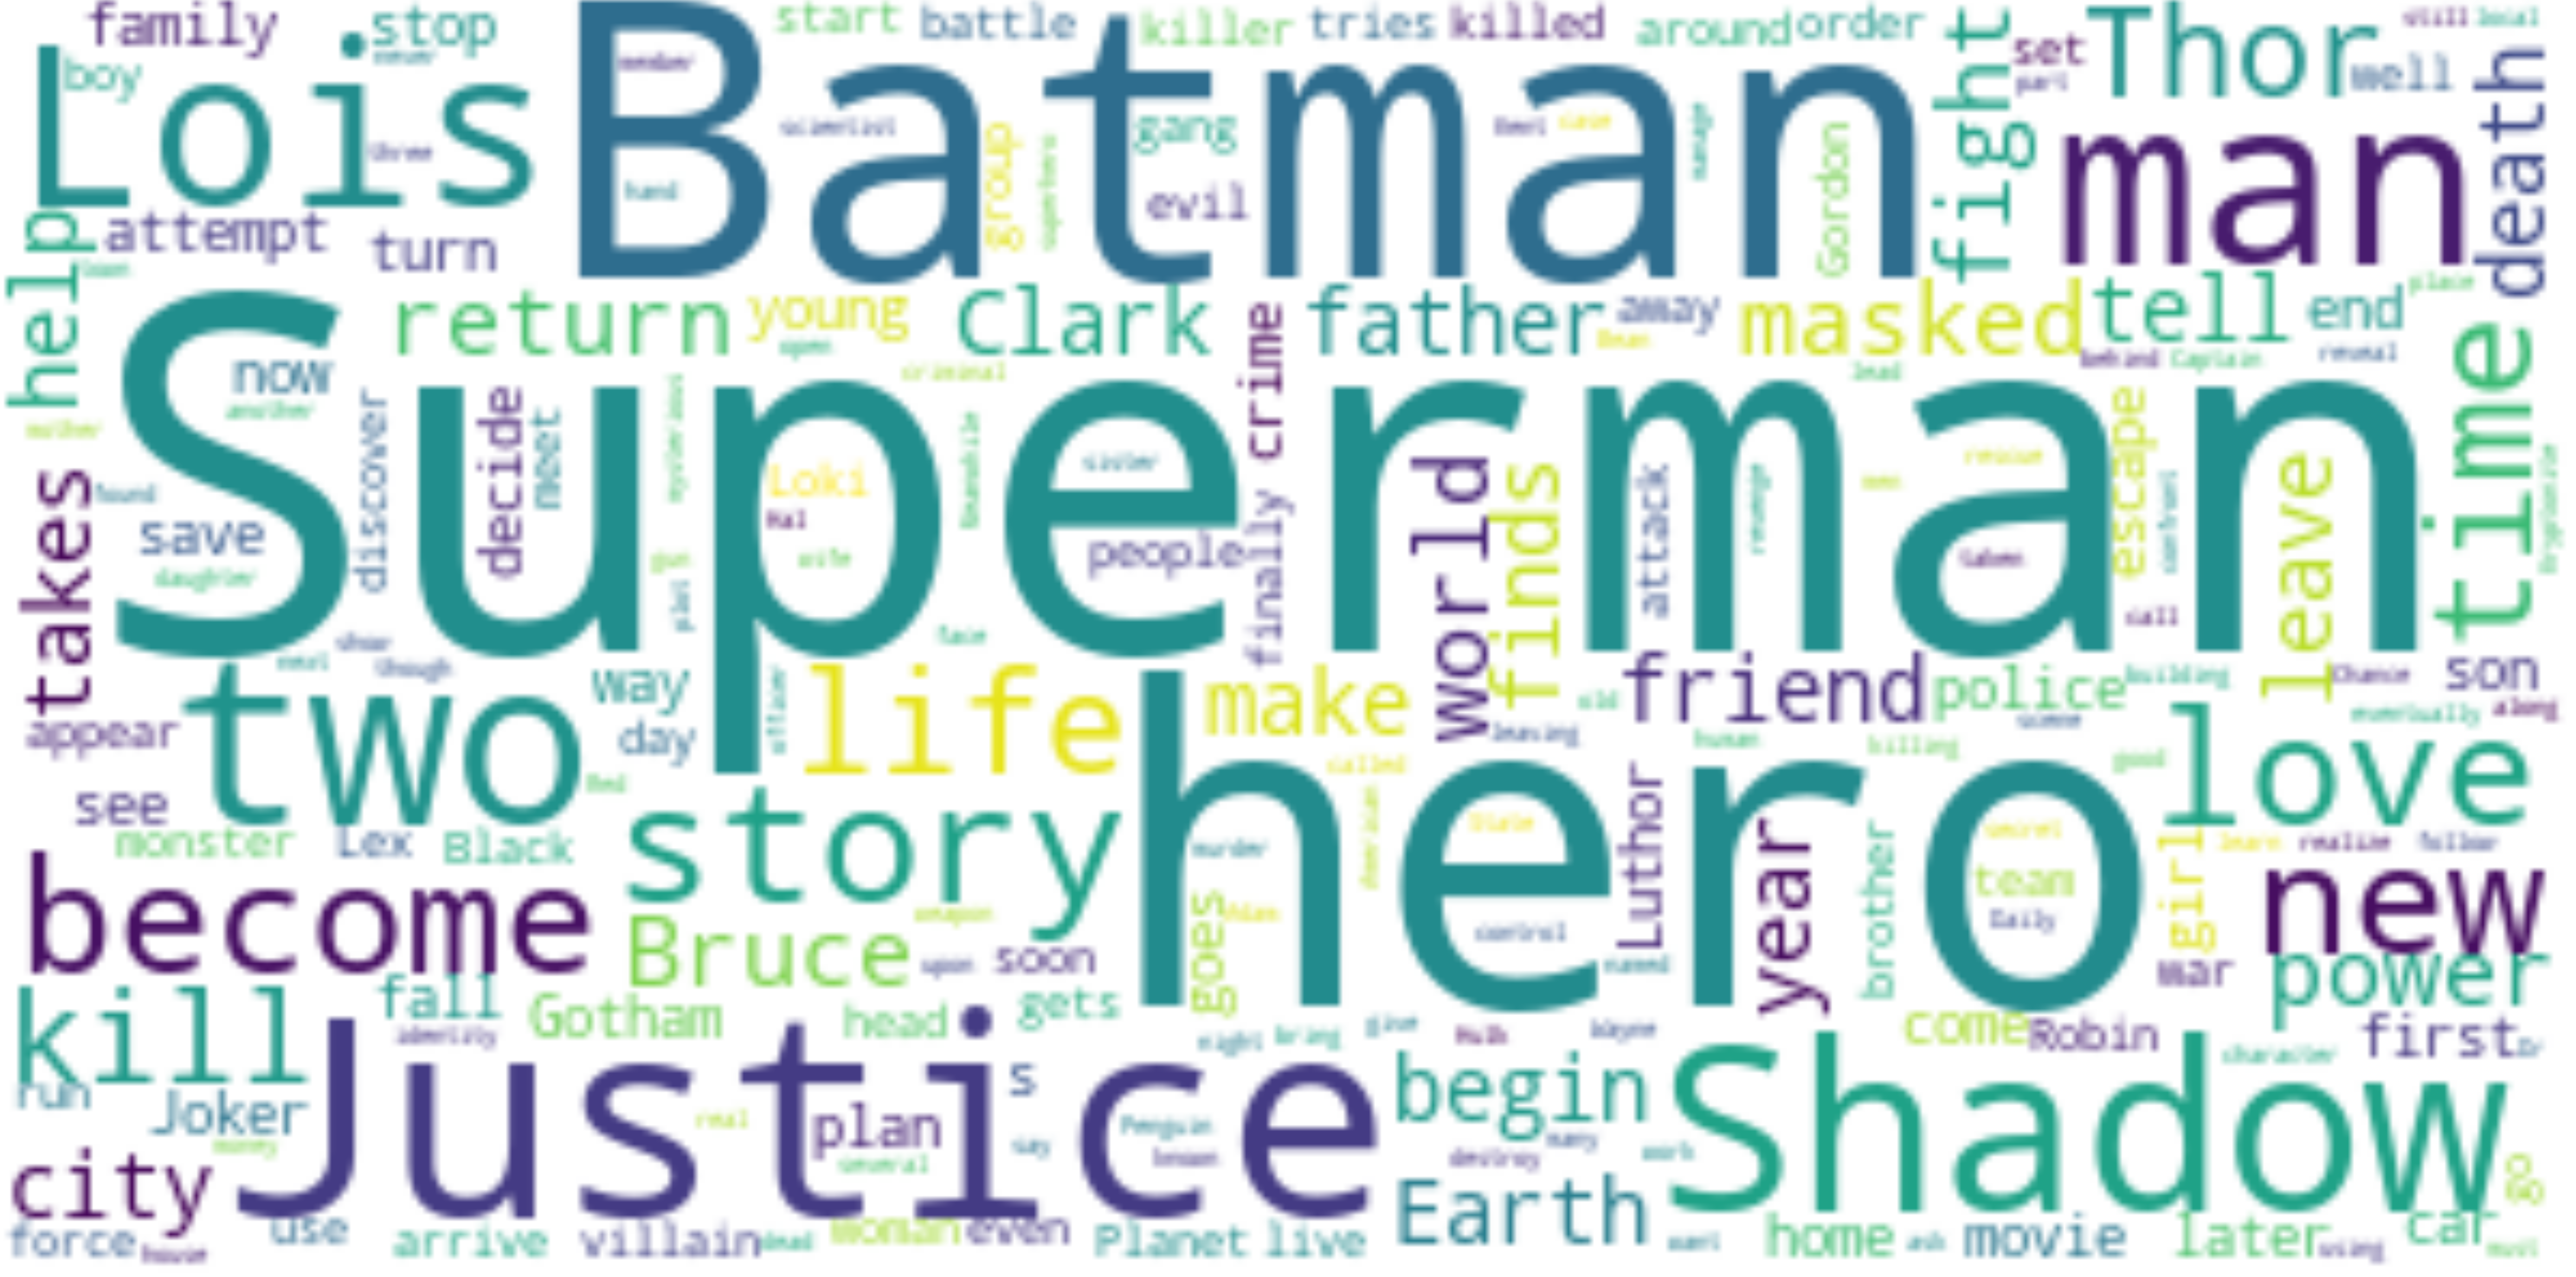
Comics
~1935-
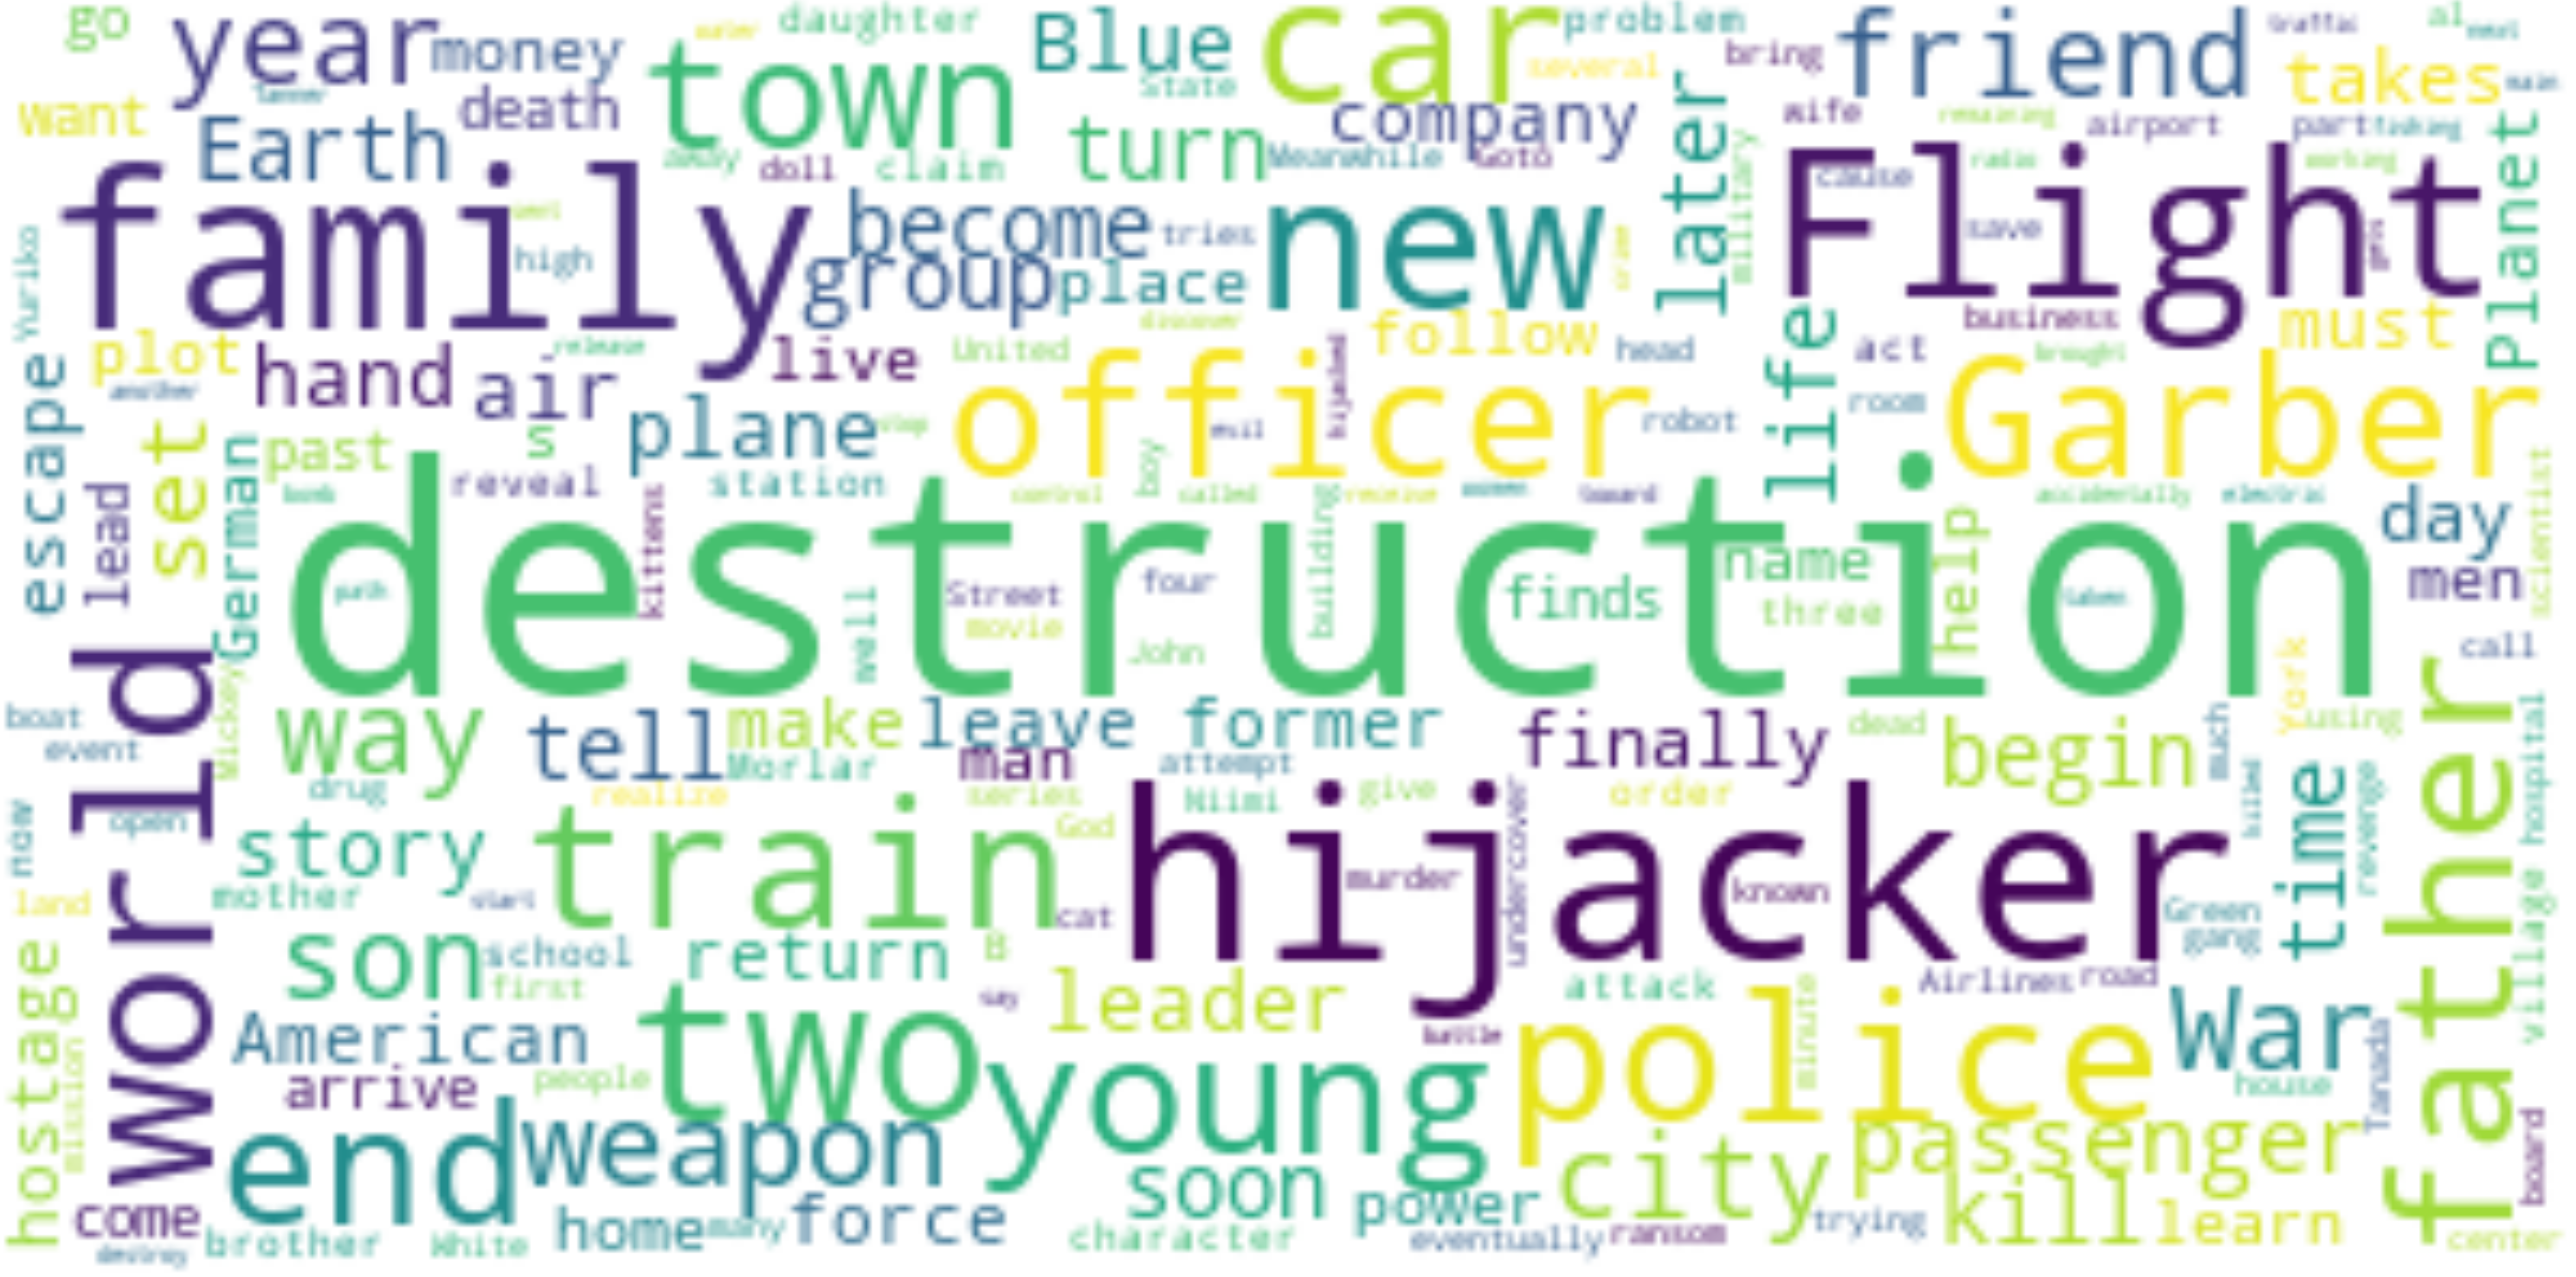
Islamist Terrorism
~2001-